















Heating costs are rising, your budget is under pressure, and every offer promises you savings of 20, 30 or 35 per cent. The figure sounds good. It’s easy to sell. It appears in almost every brochure on energy efficiency. The problem isn’t the figure itself. It’s a figure without a source. Without a verified source, any percentage figure remains, for the time being, nothing more than a claim.
For you, as a facility manager, head of technical services or member of senior management in a care home, hotel, school, hospital or office building, this is not an academic problem. It is a practical one. At some point, you’ll need to be able to demonstrate that a measure has actually been effective. Reducing heating costs without a data basis simply doesn’t work – neither economically nor as a convincing argument to funding bodies, owners or regulators. And even if you’re already collecting data, you’re only halfway there. Raw data alone doesn’t reduce heating costs. It’s only when you analyse it that a series of figures becomes a basis for decision-making.
Is your annual bill your only source of data? That’s not enough
Be honest with yourself: what data do you actually have on your heating energy consumption? In most care homes, hotels, schools and office buildings, the answer is the same. One source of data: your energy supplier’s annual bill. A single figure covering twelve months, for the whole building or, in the worst-case scenario, several buildings.
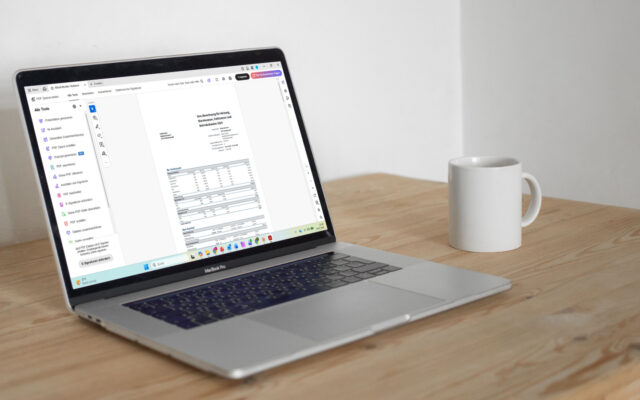
You can’t really tell much from this single figure. You can’t see whether your consumption differs on weekdays compared to at the weekend. You can’t tell whether a particular room or floor is using a disproportionately large amount of energy. And, above all, you can’t tell whether your latest measure has made any difference. Have you adjusted the heating schedule, replaced a window or introduced a night-time temperature reduction? The effect gets lost in the annual statement amidst a mild winter, changes in occupancy and rising energy prices. You can no longer pick it out.
That is the real crux of the problem. It’s not a lack of ambition, nor a lack of budget. You simply lack any data source that would allow for an analysis by day or by building section. Without this level of detail, any claim of savings remains unprovable – in both directions. You cannot prove that a measure has been effective. Nor can you identify one that has been ineffective.
Benchmarks are helpful, but they don’t prove anything
Industry benchmarks such as the GEFMA guidelines or consumption figures from Curacon or BMG analyses give you an initial assessment. They show the typical range of heat consumption per resident, per room or per square metre in your building category. This is sufficient for a rough guide.
However, it is not enough to make a reliable assessment of your own building. Two care homes with the same number of residents can have completely different consumption levels. This could be down to the year of construction, insulation standards, usage patterns, or simply a ward that is traditionally set to a higher temperature than the rest. A benchmark tells you roughly where you should be. It does not tell you where you actually are. Only genuine energy monitoring of the heating system, which provides property-specific consumption data, can bridge this gap.
Will energy monitoring for heating soon be compulsory for you?
What was previously mainly a business recommendation is now becoming a legal requirement in Germany. And this applies to far more buildings than you might think.
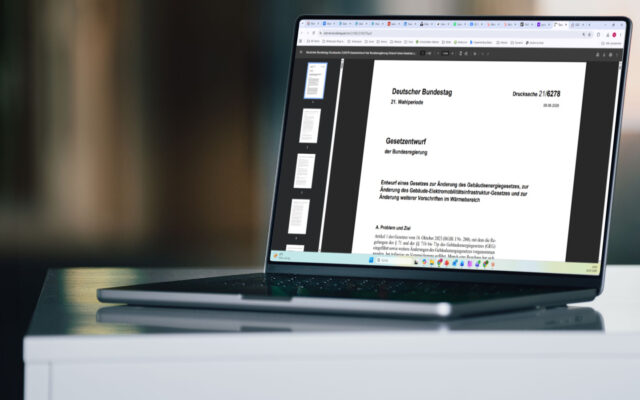
The current Section 71a of the Building Energy Act (GEG) requires non-residential buildings with heating, cooling or ventilation systems with a rated output of over 290 kilowatts to have digital energy monitoring technology. The requirement is for continuous monitoring, logging and analysis of the consumption of all main energy sources, not just a rough annual reading. This obligation has already applied to existing buildings since the start of 2025.
Under the German Building Modernisation Act (GModG), which is intended to replace and build on the GEG, this provision is moved to the new Section 56. The Bundestag passed the GModG on 10 July 2026, and the Bundesrat has given its approval. Publication in the Federal Law Gazette is still pending at this stage. In terms of content, the Act introduces a significant tightening of the requirements, which were already enshrined in the GEG: the threshold for existing non-residential buildings is reduced from over 290 kilowatts to over 70 kilowatts of installed capacity, with a retrofitting deadline of the end of 2029. A significantly larger group of office buildings, administrative buildings and schools will therefore be required to record consumption data; without this, you have so far only been able to estimate savings.
If you invest in energy monitoring for your heating system today, you are taking a forward-looking economic approach and are on the safe side, regulatory-wise, of a trend that is clearly emerging.
Where your data must come from
You cannot retrospectively calculate the missing breakdown from your annual statement. It can only be generated if data is collected from the outset at the point where heating is actually used – at each individual radiator, in every room, at all times. The better.energy IoT platform offers one way of achieving this.
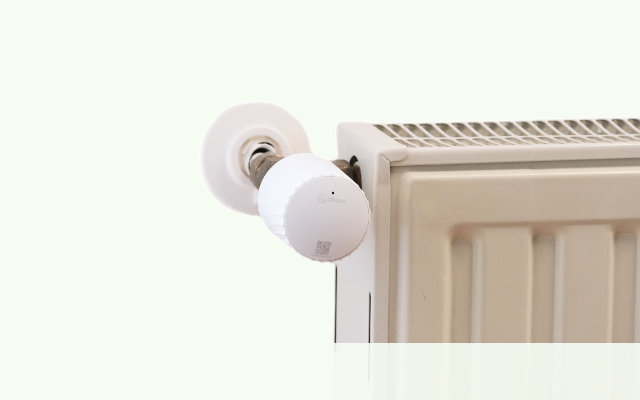
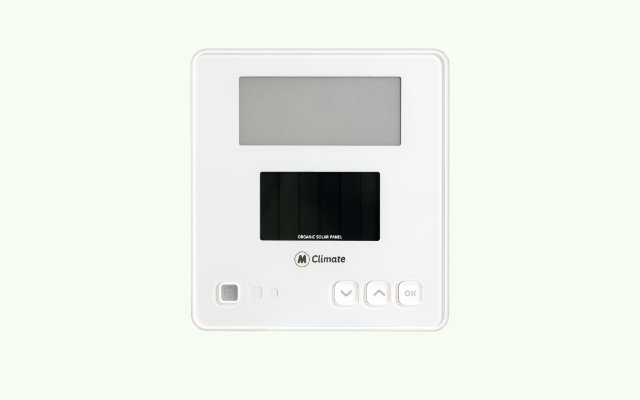
Technically, this means each radiator is fitted with a LoRaWAN thermostat head that controls the set temperature and knows the valve status. Window contacts alert you if a window is open and the heating should not actually be running. This information is transmitted via one or more gateways to a central platform. There, it is assigned to rooms and parts of the building and stored over time. It is only through this chain – from the individual sensor to the structured storage in the software – that you obtain a database which can be analysed by day, week, station or floor.
The following table shows you the difference in practice:
| Data source | Resolution | Frequency | What you see |
|---|---|---|---|
| Annual statement | Entire building | Once a year | Only the absolute total consumption |
| better.energy | Individual appliances | Continuous | Appliance status, error messages |
| better.energy – Control | Individual room | Continuous | Heating behaviour, running times, open windows |
| better.energy – Monitor | Individual heat meter | Hourly | Heating behaviour, running times, open windows |
An automated radiator control system such as better.energy generates useful data even during normal operation, without the need for a separate measurement project. How long a system runs in automatic mode, how often it has to work against an open window, and how much individual rooms deviate from the planned temperature profile: all this information is generated as a by-product of the control system itself.
The real problem, therefore, is rarely that you lack this data once the appropriate technology has been installed. The problem is that it remains in its raw form, without being translated into key performance indicators that you need for internal reporting, care rate negotiations or an energy audit. At this stage, simply collecting the data is not enough.

Accurate heat consumption figures with better.energy – Monitor
If you want to see not just the control behaviour but the exact heat consumption in kilowatt-hours, you need more than just the control level. That’s where the better.energy – Monitor module comes in. It records heat consumption via LoRaWAN heat meters and transmits the consumption data to the platform hourly, broken down by individual meter rather than just as an annual figure from the main meter.
A real-world example: in a care home network comprising four buildings, just one heat meter per building is enough to identify which building is consuming a disproportionately high amount of heat, without you having to measure every single radiator. Once the outlier has been identified, you can target your efforts there, rather than applying optimisation measures indiscriminately across all buildings. Exactly the same principle applies in a hotel with several wings or in a hospital with several wards.
If you need reliable evidence, quantified in kilowatt-hours – for example, for ISO 50001, a care rate negotiation or an energy audit under the GEG (or, in future, the GModG) – there’s no getting round this precise data collection. If your primary aim is initially to identify waste in operational behaviour, the control data from better.energy will suffice for the time being. Both approaches can be combined, depending on how precise your data set needs to be.
From raw data to key performance indicators: better.energy – Analyze
To ensure that your collected data forms the basis for decision-making, Betterspace is launching a new, paid add-on module in autumn 2026: better.energy – Analyze. It works on the basis of the data that better.energy continuously collects, and uses it to:
- Make waste visible: You can identify recurring patterns – such as overheating or heating with windows open – not just as isolated incidents, but as part of a wider system.
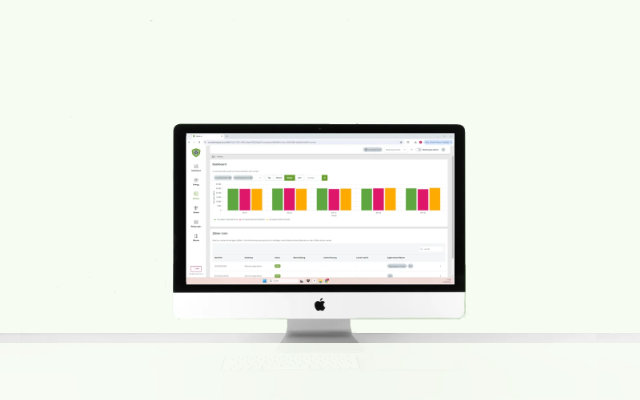
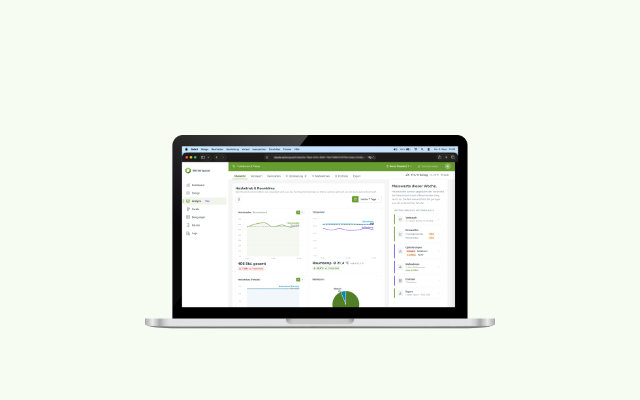
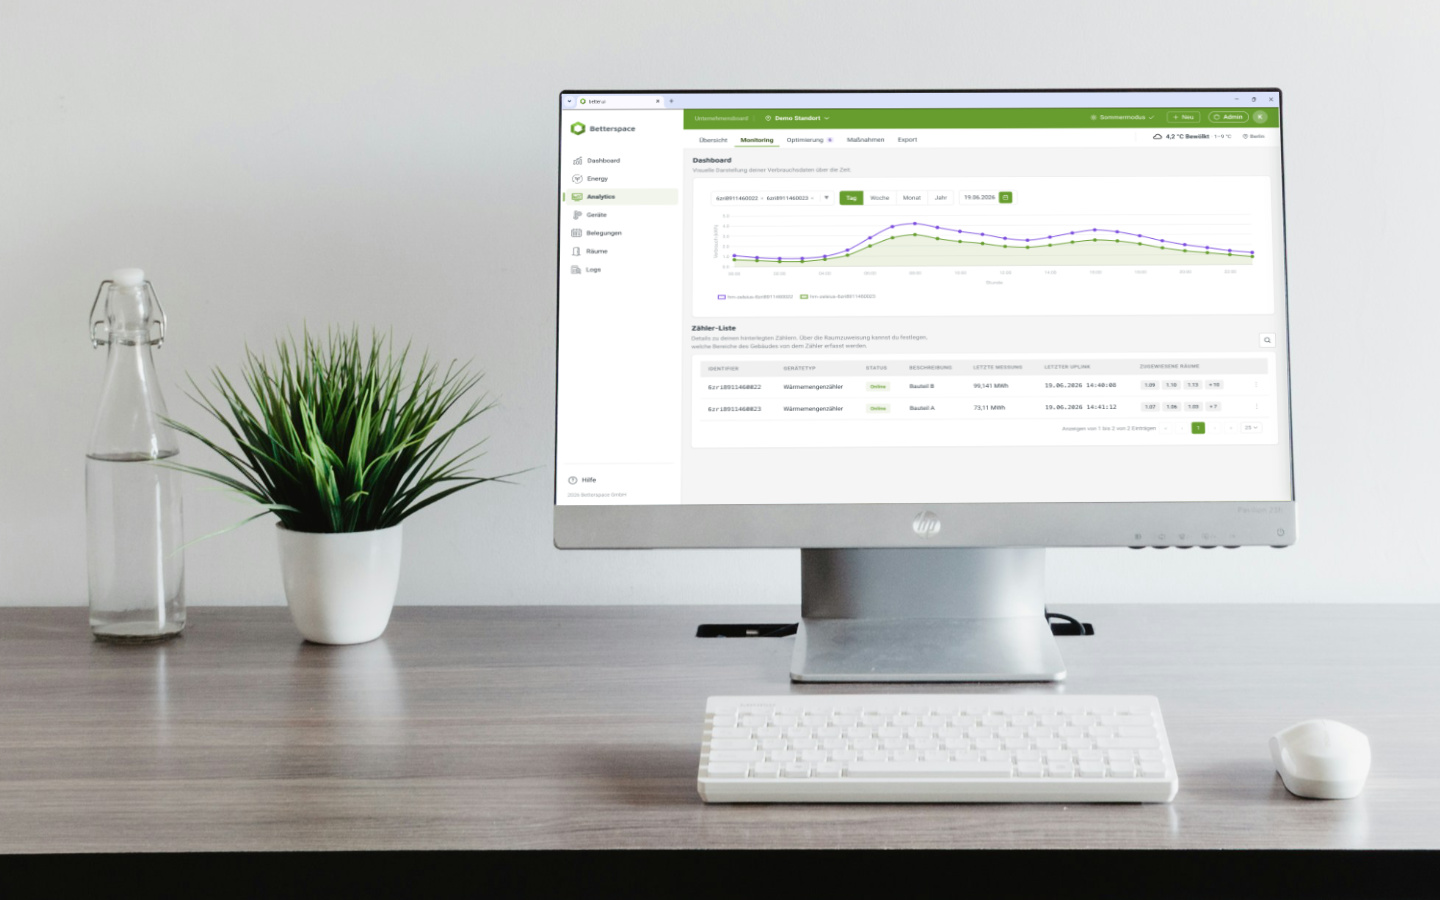
- Turn raw data into key performance indicators: You can view heating hours, overheated rooms and runtime in automatic mode all in one place on the dashboard, without having to calculate them manually.
- Document measures: Your optimisations become traceable over time, serving as a basis for internal reports and external evidence.
- Help with compliance: ISO 50001 and the GEG – or future GModG – requirements demand proof that you identify and rectify inefficiencies. This is precisely where Analyze provides you with support.
Important for you: Analyze does not require an additional Monitor module. It analyses the data that better.energy collects as standard during normal operation. If you also need the exact heat output per meter, you can retrofit the Monitor module. Data collection and analysis are two separate steps that build on one another. A data set without analysis is just as useless as an analysis without a data set.
What other building operators have already achieved
At the moun10 youth hostel, an analysis of energy consumption in relation to room occupancy showed that the building’s base load fell from 172 to 65 kilowatts, resulting in additional savings of over 3,500 euros per year compared with the local municipal utilities. At the Hotel Oderberger in Berlin, the energy bill remained stable, even though energy prices rose during the same period. At Korian, a reduction in heating energy consumption of around 25 per cent was recorded across 54 sites. At stuub, operated by Black Forest Hospitality, the measured saving across 18 buildings was around 40 per cent.

This is also the basis for our claim that better.energy can deliver savings of up to 35 per cent. This figure is not a guarantee for every building. It represents the upper limit derived from precisely these specific projects. You will only know what this means for your building once you have collected and analysed your own data – not before.
These figures are derived from internal analyses carried out by the respective operators. What is important is what these figures do not show: they demonstrate that better.energy has an overall effect, but do not specify how much each individual optimisation has contributed. Until now, customers have had to determine this breakdown themselves at their own expense. It is precisely this gap that better.energy – Analyze aims to close in future (the impact assessment is planned as a feature of the module). Not just to confirm that something has improved, but to show which part of that improvement is attributable to what. This, too, is energy monitoring for heating – just one level deeper.
Conclusion: Collect data now, analyse it later
Reducing heating costs without a data basis simply doesn’t work, no matter how convincing the percentage figures in the quote may sound. As long as you don’t know exactly where, when and how much heat is being consumed, and as long as nobody analyses this data, savings targets will remain nothing more than wishful thinking. General benchmarks can help with an initial assessment, but they are no substitute for property-specific measurements in your own building. The legislator has made this a regulatory requirement in Germany, which will in future apply to all buildings with systems rated at 70 kW or more.
Anyone who only gets started in the 2027/28 heating season will have already missed out on a heating season during which they could have measured and optimised their building’s performance. Two heating seasons without data also mean two heating seasons without reliable evidence, whether for care rate negotiations, an energy audit or the ISO 50001 report. If, on the other hand, you start now, by the time better.energy – Analyze launches in September 2026, you’ll already have a database that makes the analysis meaningful from day one.
Your next step
Not using better.energy yet?
If you get started now, you’ll have your first dataset ready for the 2026/27 heating season – just in time for the launch of Analyze in the autumn. Arrange a no-obligation initial consultation, implement better.energy and lay the foundations before the next heating season begins.
FAQ
A main meter simply shows you your building’s total consumption over a billing period – nothing more. You cannot see which part of the building is consuming how much, nor whether a particular measure has been effective.
For optimisation and verification, you need a more detailed breakdown in terms of both space and time, either via the control data from better.energy or via additional heat meters in the Monitor module.
No. better.energy – Analyze evaluates the data that better.energy collects during normal operation anyway. Monitor is useful if you also need exact heat quantities in kilowatt-hours, for example for ISO 50001 or an energy audit. Both modules can be combined, but can also be used independently of one another.
Reliable conclusions should be based on data covering at least one full heating season. If you start in the summer of 2026, you will have your first data set by the end of the 2026/27 heating season. In the following winter, you can then compare two periods and evaluate measures reliably. Of course, you can also compare data within a single heating season.
Sources
- Deutscher Bundestag / Bundesregierung: Kabinett beschließt Gebäudemodernisierungsgesetz,
- energie-experten.org: Gebäudemodernisierungsgesetz: Was ändert sich im GModG?
- iwpro.de: Gebäudemodernisierungsgesetz (GModG) statt GEG: Was sich ändert
- BBSR GEG-Infoportal: Auslegung zu § 71a Absatz 1 GEG 2024
- dena / KEDi: Verpflichtende Gebäudeautomation in Nichtwohngebäuden (§ 71a GEG)
- Betterspace: better.energy – Analyze
- Betterspace: better.energy – Analyze Early Access
- Betterspace: Base load reduced by 62 per cent: Sustainable energy optimisation at the moun10 youth hostel in Garmisch-Partenkirchen
- Betterspace: Heizen im historischen Bestand: Wie das Hotel Oderberger Berlin das Heizen automatisiert
- Betterspace: Major care project increases energy efficiency – How better.energy is increasing Korian’s energy efficiency in over 50 care facilities
- Betterspace: Intelligente Heizkörpersteuerung in stuub Apartments: Black Forest Hospitality spart rund 40 % Energie ein