













Analysing heating data and consumption
better.energy – Analyze:
Get a clear picture of your energy consumption
better.energy – Analyze
Understand your consumption, improve your efficiency
With the better.energy – Analyze module, you have everything you need to efficiently analyse the heating patterns of your properties. Monitor heating efficiency, identify anomalies and inefficiencies in heating patterns, document the measures taken, and harness the full optimisation potential of your data to make informed decisions.
Data instead of gut feeling
Waste less energy, gain more control
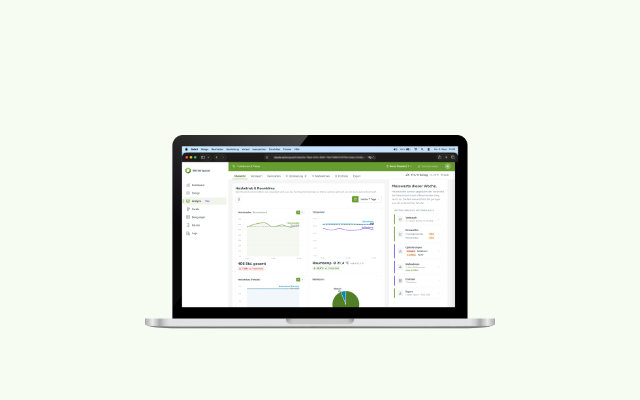
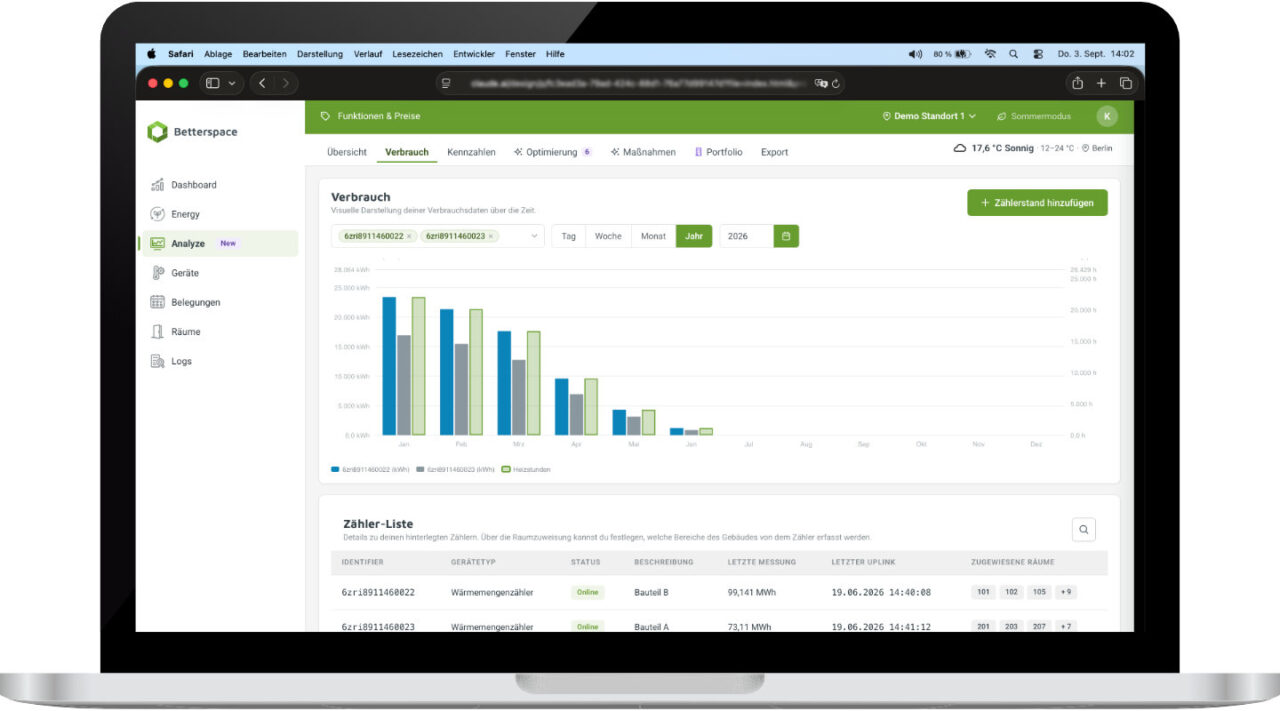
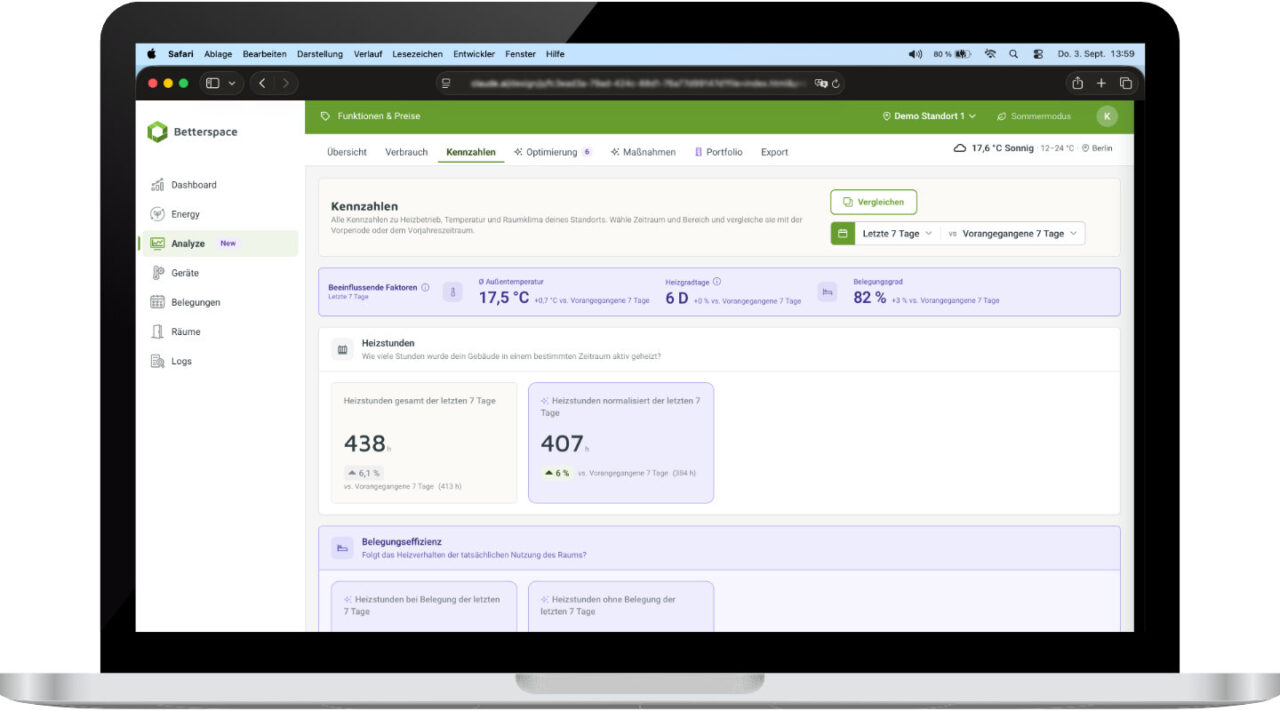
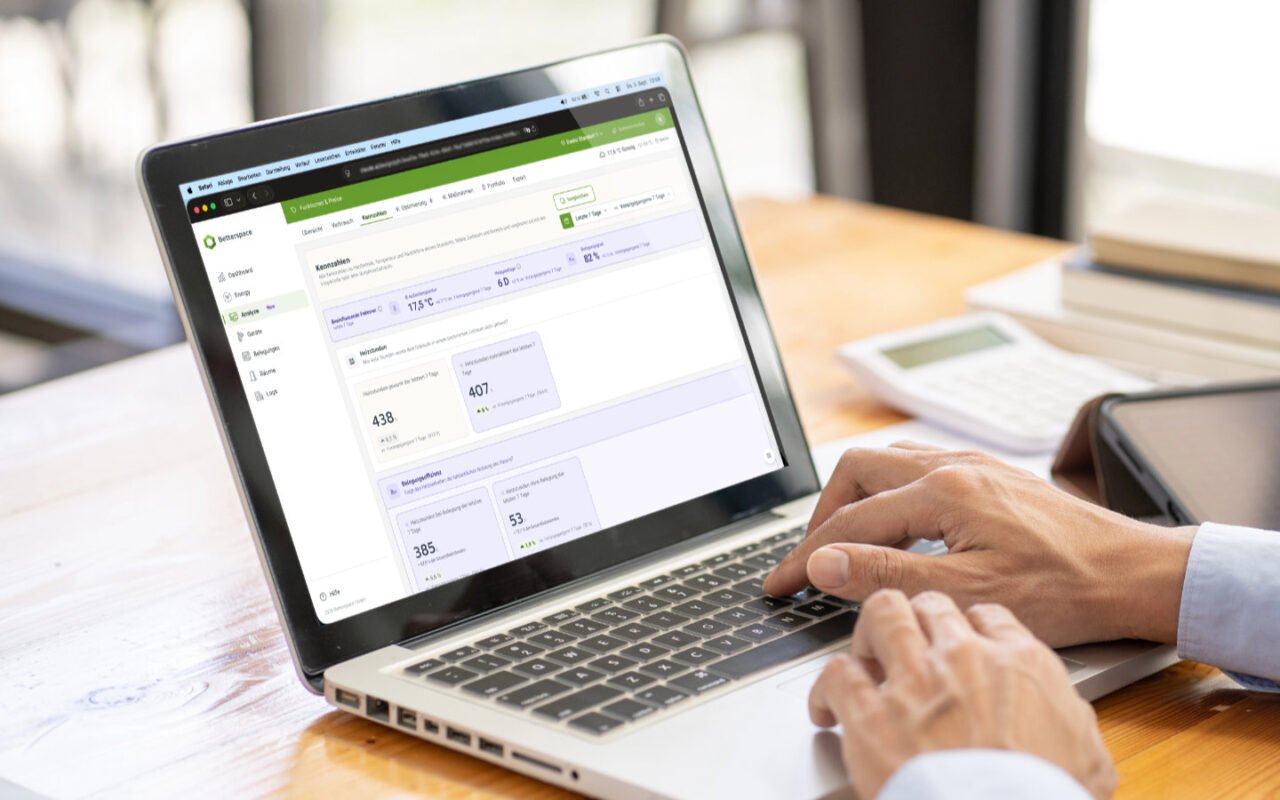
better.energy – Analyze is the analytics module for the better.energy IoT platform. The analytics module is designed for anyone who no longer wishes merely to manage their energy consumption, but also to analyse and document it. It processes the data generated within the platform into reliable key performance indicators and highlights waste before it appears on the annual bill.
Inefficient heating
What your heating really costs, and what you can do about it
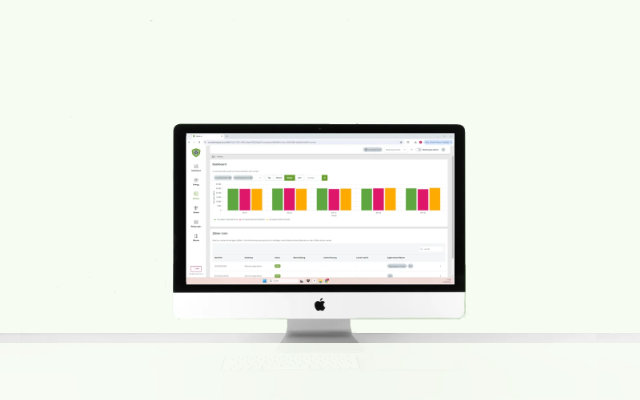
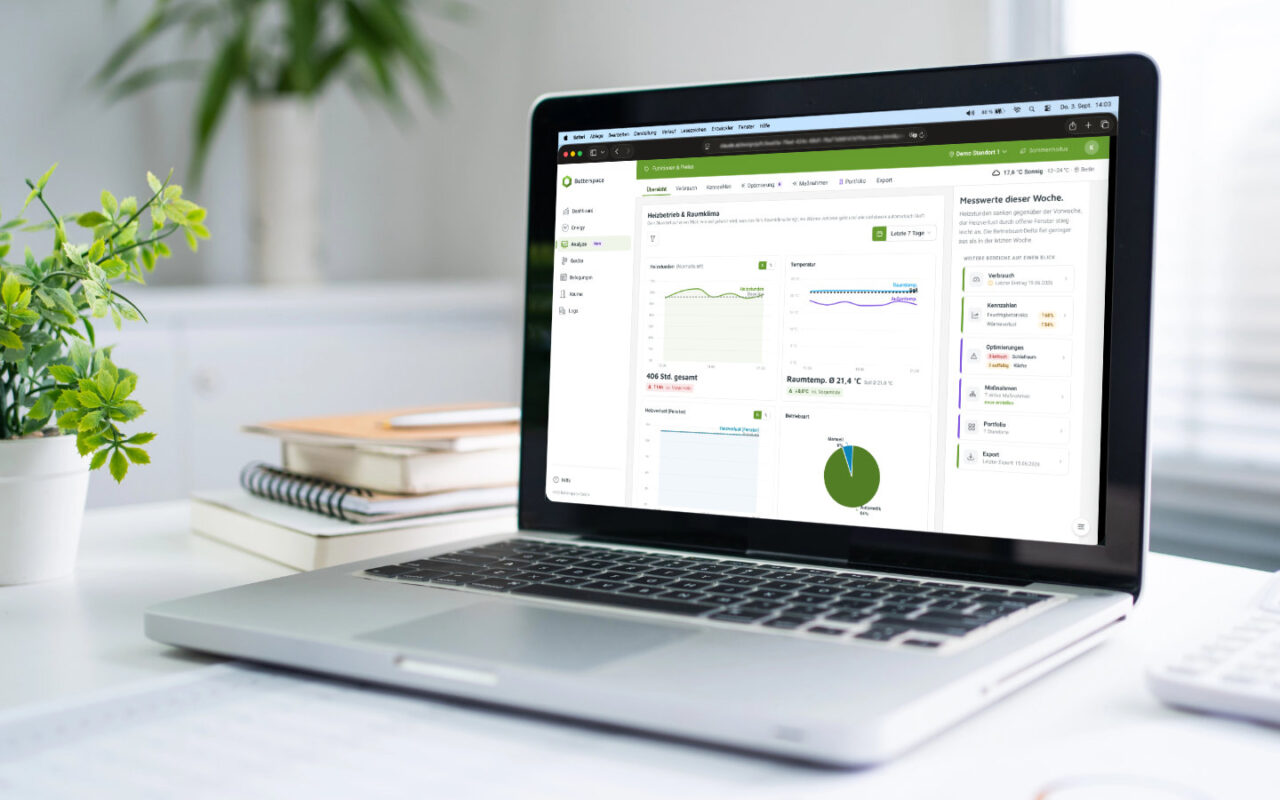
Without a real-time view of your heating system, optimisation remains out of sight. better.energy – Analyze provides you with real-time key performance indicators that highlight anomalies before they appear on your annual bill. Overheated rooms, heating with windows open: Analyze automatically detects these anomalies and provides your team with specific optimisation options. Furthermore, heating consumption is continuously monitored and all measures are documented. The module therefore also supports you with reporting and compliance issues.
better.energy – Analyze is worth it
The right answer for every role
Facility Managers & Technical Managers
Facility managers and technical managers can monitor the heating system without having to be on site. Anomalies and recommendations for action replace gut instinct and the need to walk the rounds of the building.
Property Managers & Location Managers
For location managers and property managers, the dashboard provides an overview that is reliable even without a dedicated energy manager. The key performance indicators ensure a thorough understanding of heating and its efficiency.
Business Management & CEOs
For senior management and business management, the dashboard provides the data foundation that justifies investment in energy-efficiency measures and fulfils the obligation to provide evidence to auditors, inspectors and investors.
Portfolio Managers &
Asset Managers
For portfolio and asset managers, cross-property comparability becomes a reality at the click of a button. Internal benchmarks are automated, and data submission from the sites is handled automatically and in a standardised manner.
Anomaly detection
Waste becomes visible by itself
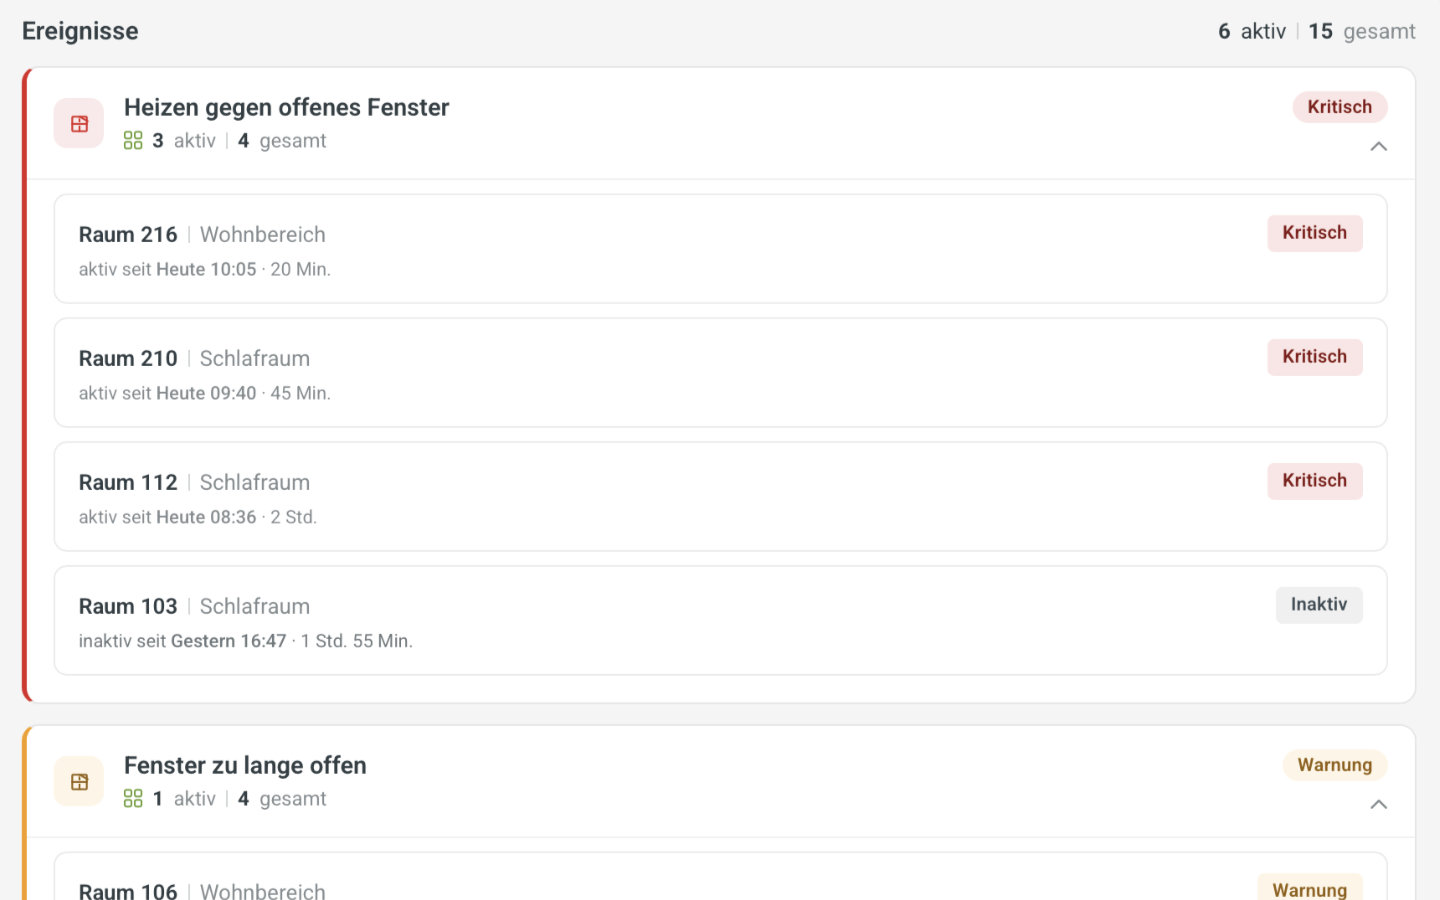
Traditional reporting shows you how much energy has been used. Analyze shows you where something is wrong. The module automatically detects typical inefficiencies in heating operation: continuous overheating due to manual interventions, or heating whilst windows are open. For each anomaly, you receive recommendations for action and a specific point of action within the building.
This turns the question “Why is our consumption so high?” into a list of actionable tasks. Your building services engineer knows which room to check. And you can see later whether the measure has been effective.
Audit preparation & documentation
The data source trusted by professionals
Energy reporting requirements are on the rise. The German Building Modernisation Act (GModG) requires non-residential buildings with heating or air-conditioning systems with a rated output of 70 kW or more to have a digital system for building automation and control. The Energy Services Act (EDL-G) requires large companies in Germany to carry out regular energy audits in accordance with DIN EN 16247. ISO 50001 requires certified energy management systems to use methodologically sound energy indicators and to analyse them over time.
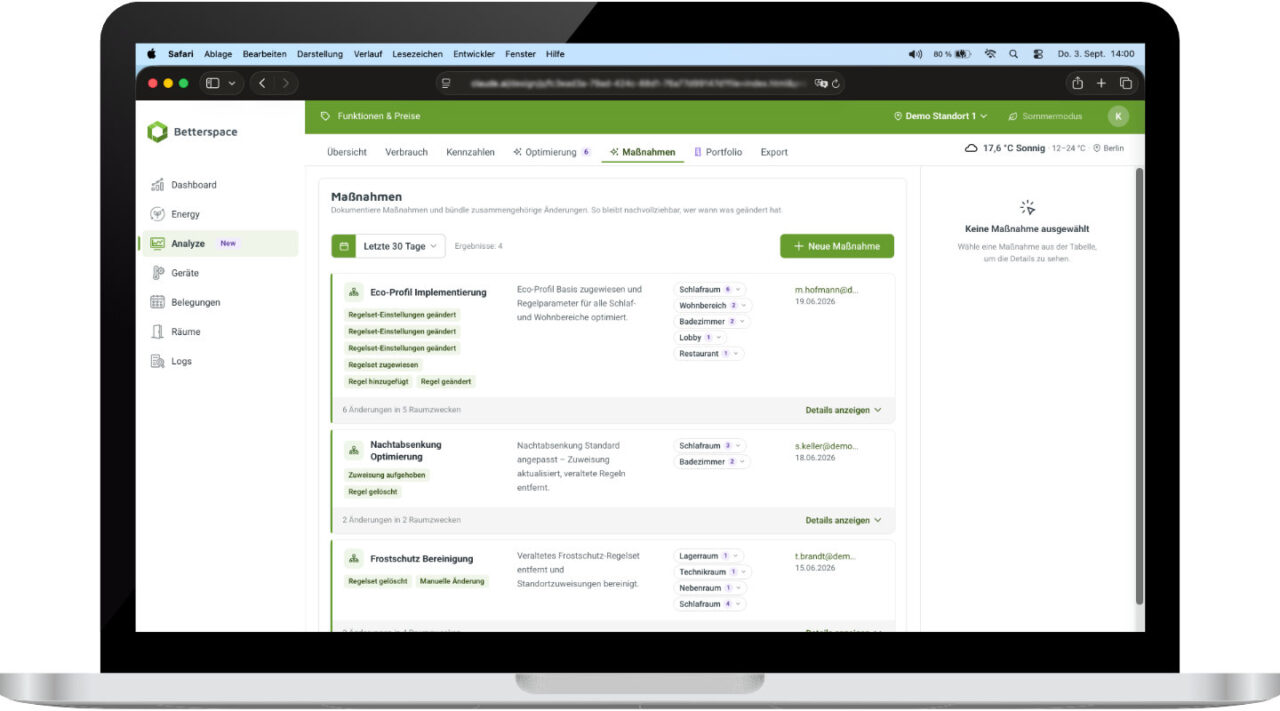
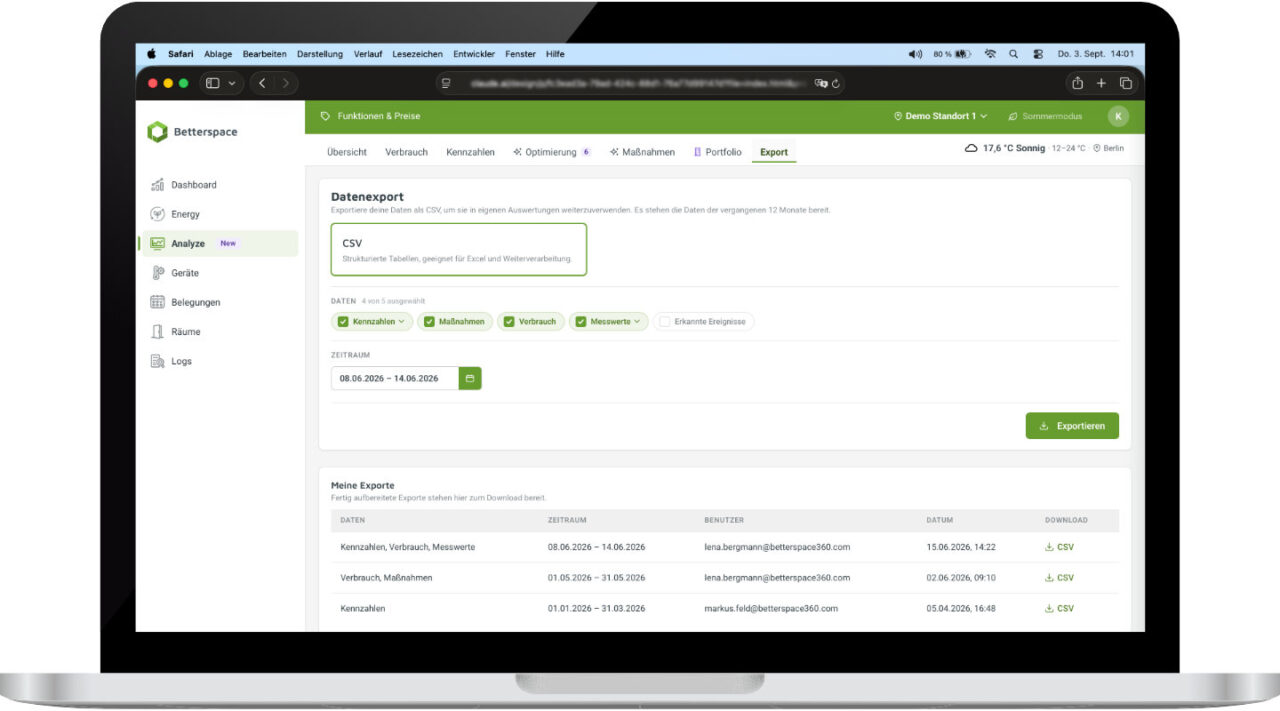
better.energy – Analyze provides you with the structured data foundation for this. The module logs all heat-related changes, documents measures implemented, provides methodically calculated key performance indicators in a time series, and exports everything as a CSV file for further use by energy consultants, auditors or for internal reporting. The module is not a substitute for certification, but it provides you with exactly the data foundation that your energy consultants and auditors need for their work.
Comparability
A glance at all the properties, a click on the outliers
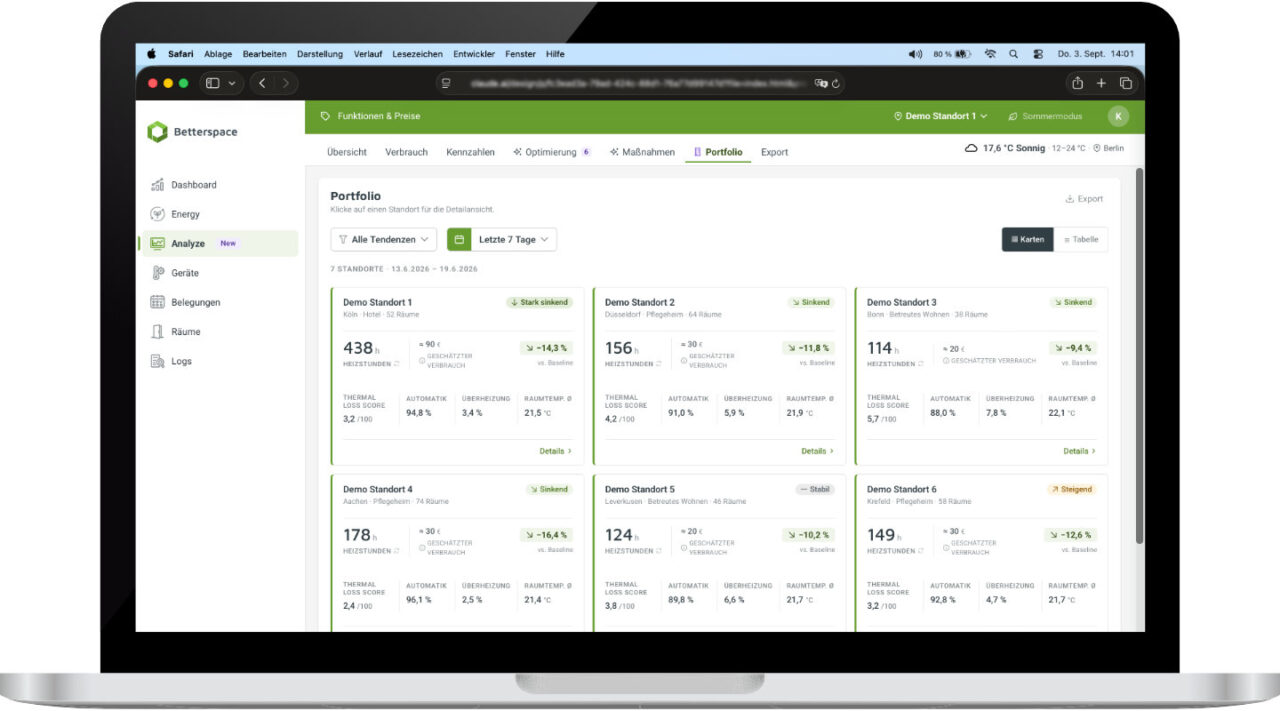
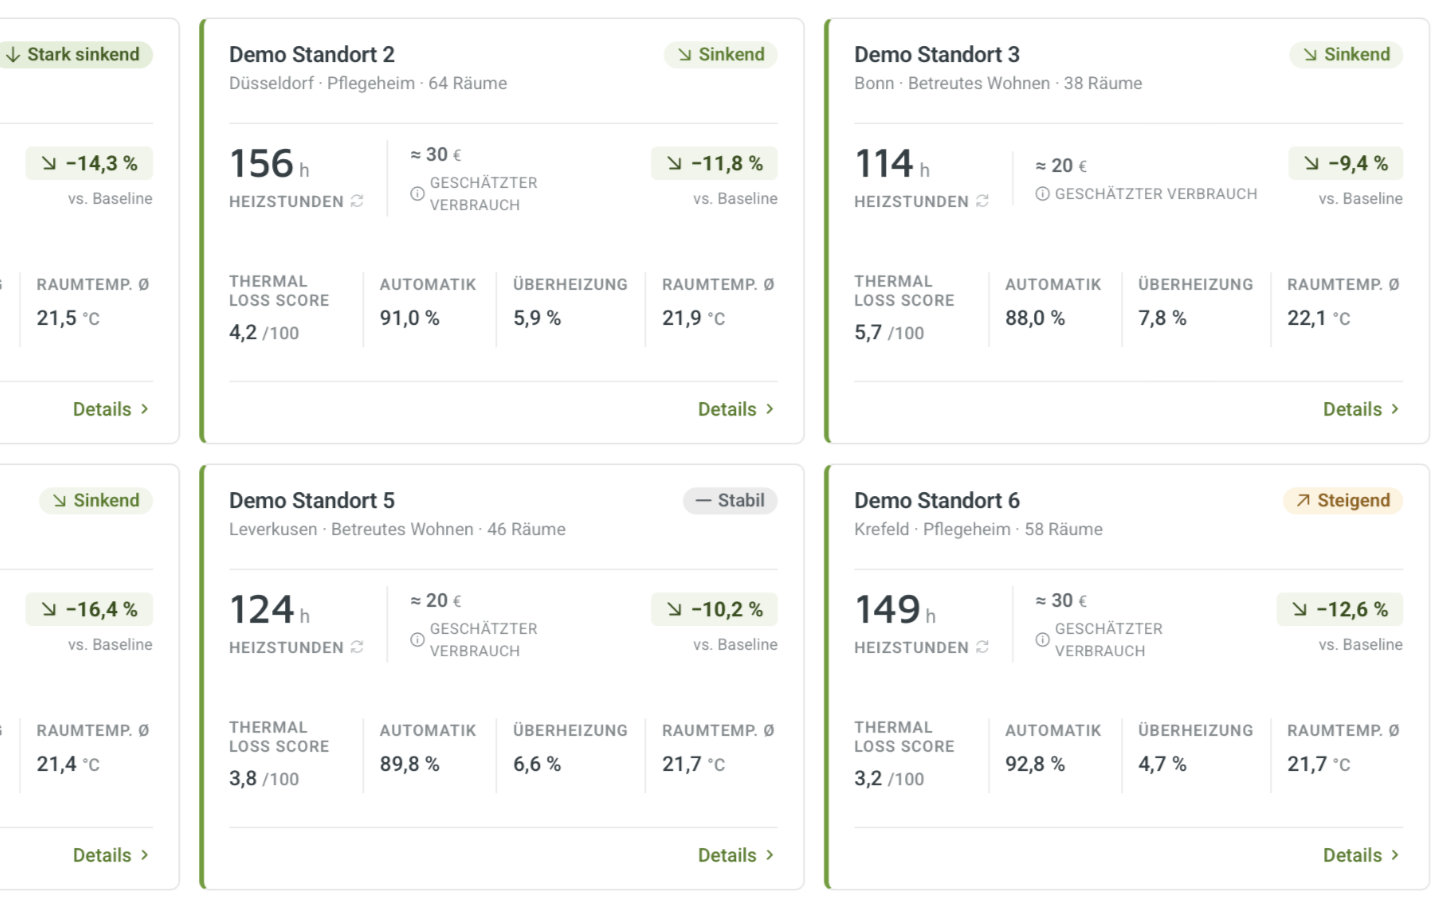
Anyone who runs more than one site is familiar with the problem: each property reports its figures differently, so ensuring comparability is a manual task. For chains, operators and management bodies, Analyze displays all sites on a single screen in the portfolio view, highlights the best and worst performers, and normalises heating hours to account for weather conditions (heating degree days), so that a site in Rosenheim can be fairly compared with one in Hamburg.
On this basis, best practices become apparent. What works at Location A becomes the blueprint for Location B. And where a property consistently falls out of line, your team knows where to look more closely.
Integration with better.energy
Make the most of what you already have
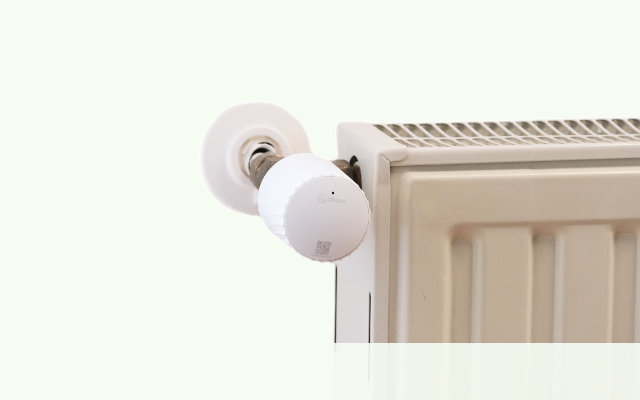
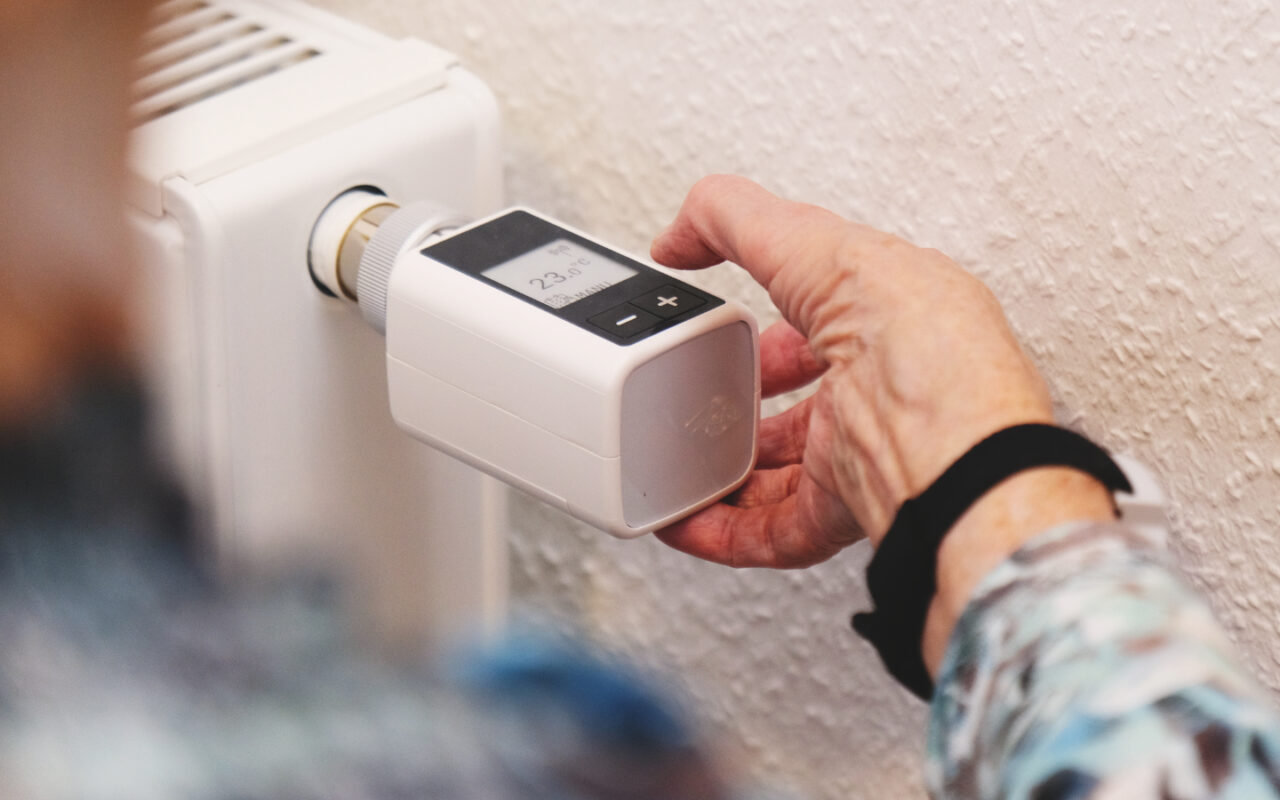
better.energy – Analyze works directly with data from the better.energy platform. If you’re already using the automated radiator control system, you can add the analytics module as a supplementary service – no additional hardware, separate sensors or parallel software is required. You log in via the usual portal, where the module appears as an additional menu item. To maximise your building’s energy efficiency, it may be worth using additional actuators, sensors and interfaces from third-party providers, if these are not already integrated into your building.
Feedback
Results that speak for themselves

„I was delighted to be part of the development of better.energy – Analyze. The module highlights where there is still untapped potential in our existing data."

„Betterspace has proved to be the perfect project partner. The project ran exceptionally well. The team will now help us to sustainably reduce heating energy consumption – and therefore costs – in our facilities."
The perfect combination
Achieve more with Analyze and Monitor
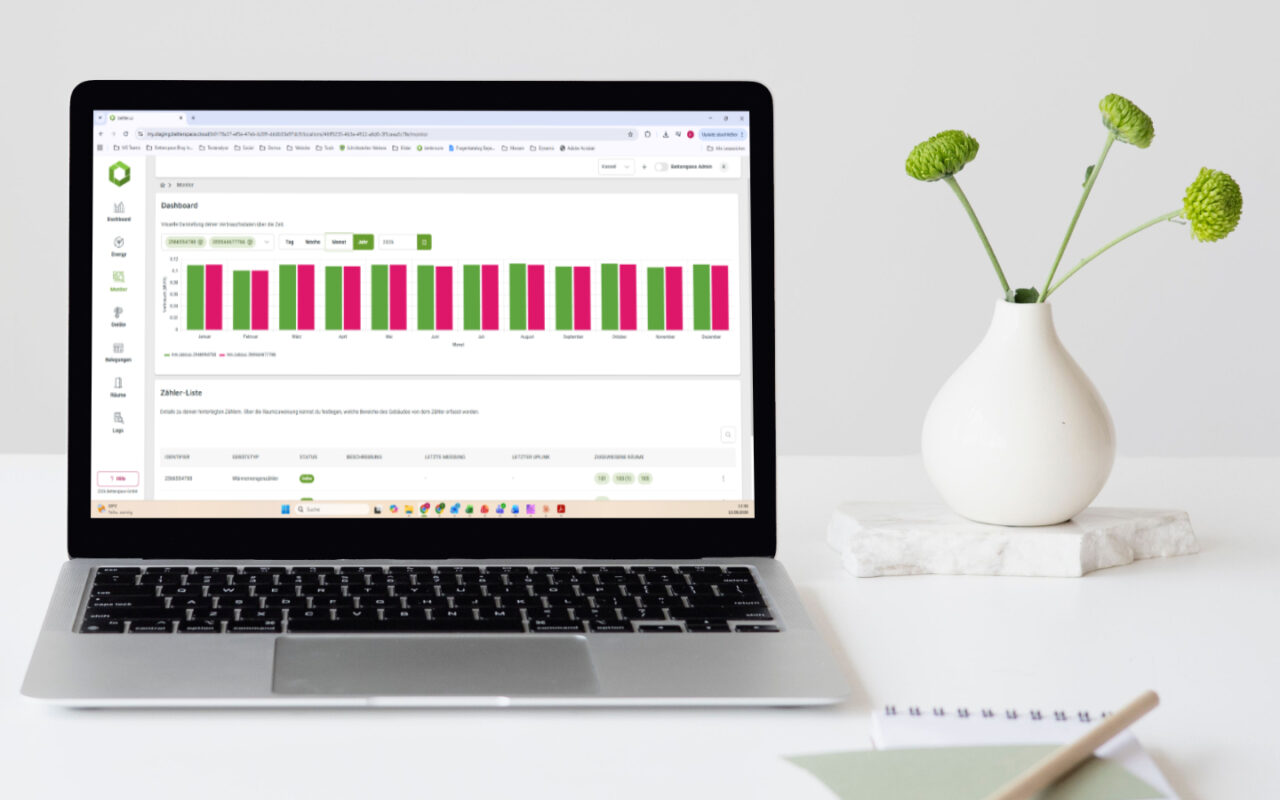
By linking the better.energy – Analyze and better.energy – Monitor modules, you can visualise results in kWh without any manual data entry. Combining both modules allows you to substantiate savings using digitally recorded heat consumption data. This means you don’t have to enter consumption figures manually into the software – it does this automatically all by itself.
Packages
Full cost transparency instead of data chaos
better.energy – Analyze is available in three packages: Basic, Premium and Enterprise. This means there’s a pricing option to suit every challenge. Do you want to understand what’s happening in your building? Then Basic is the solution for you. For more in-depth analyses and to answer the question of why something is happening, Premium – with its normalised metrics – is the right package for you. And if you want to compare multiple sites on a weather-adjusted basis, Enterprise is the perfect solution.
Get advice on better.energy – Analyze
Your heating data tells you more than you think.