















Abstract
In an unrenovated school, measurements were taken over two heating seasons to assess how the automated control of radiators using better.energy affects heat consumption. Two separate heating circuits within the same building were compared: an area controlled by better.energy and an uncontrolled reference area with an identical layout, operated manually. Over the entire measurement period, the controlled area consumed 26.3 per cent less heat.
The study design was deliberately conservative. Both heating circuits are located in the same school building and were monitored over the same period, ensuring that weather conditions and building structure were identical for both. Measurements were taken for the entire heating circuit, including corridors, rather than selecting particularly favourable rooms. This is a one-off measurement carried out during normal operation, not a statistically representative study. The complete raw data is available at hourly intervals.
The measurement setup
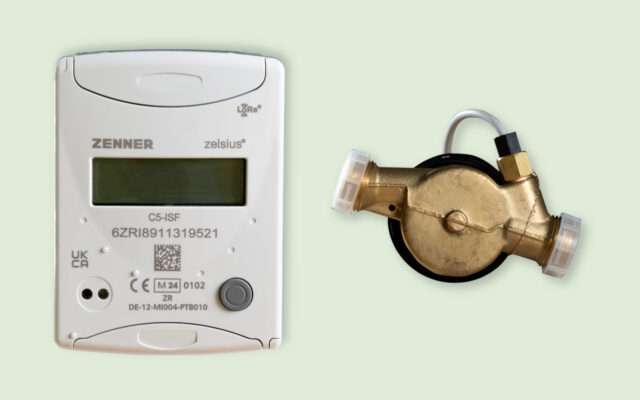
A heat meter records the actual amount of heat energy consumed.
To do this, it continuously measures the flow rate of the heating water and the temperature difference between the supply and return pipes, and uses these figures to calculate the amount of energy in megawatt-hours. One such meter was installed on the heating circuit of each of the school’s buildings A and B. The readings are transmitted hourly via LoRaWAN to the better.energy platform, enabling the heat consumption of both areas to be recorded on a monthly basis and directly compared.
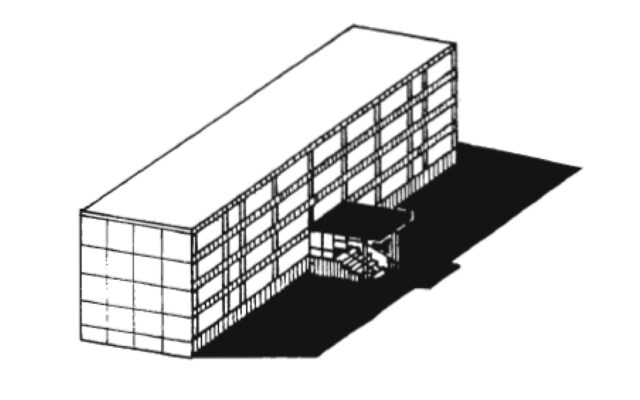
| Building type | „Chemnitz“ type school building constructed using prefabricated panels, built between 1971 and 1990, not renovated |
| Heat supply | Central heating |
| Metering technology | Zenner LoRaWAN heat meters per heating circuit, better.energy – Monitor software |
| Section A | Classrooms and corridors controlled via better.energy (10 rooms) |
| Section B | Uncontrolled, manual operation (13 rooms) |
| Heated area | According to the operator, both heating circuits supply comparably large areas |
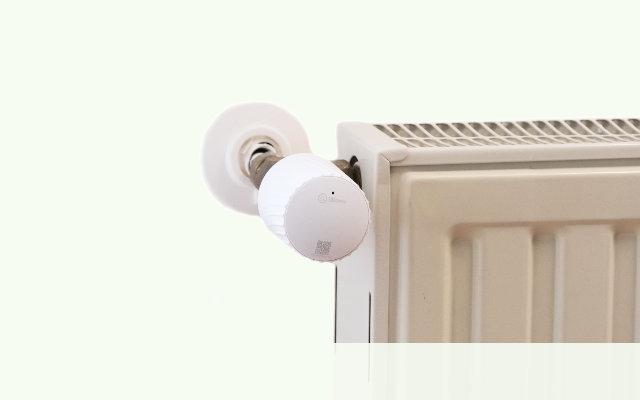
| Thermostats | LoRaWAN wireless thermostats (firmware 4.7), fully online |
| Measurement period | September 2025 to June 2026 (heating seasons 2025 and 2026) |
| Data resolution | Hourly recording, complete and uninterrupted throughout the entire period |
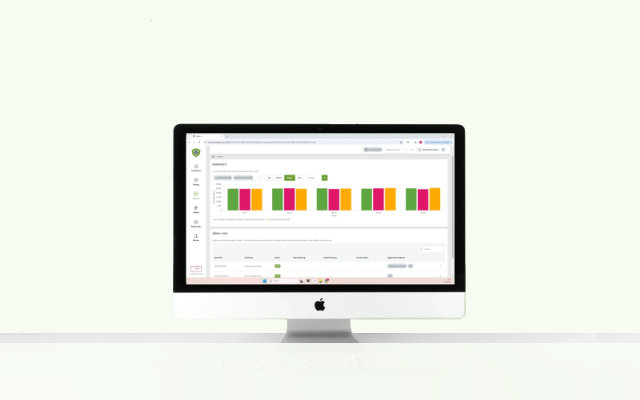
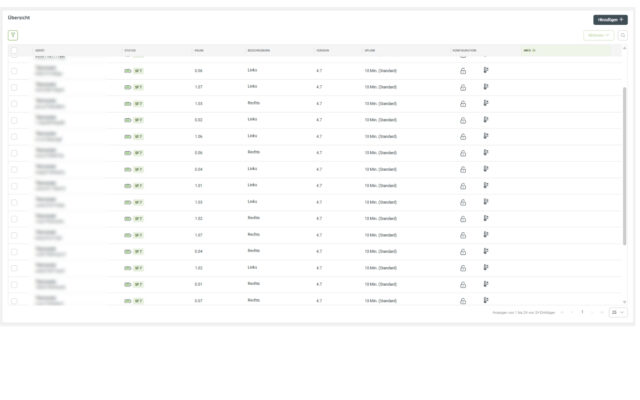
The following screenshot shows the device overview for the school building on the better.energy IoT platform. All of the school’s thermostats are online, as are two heat meters for sections A and B. The ‘online’ status confirms that data is being recorded without interruption.
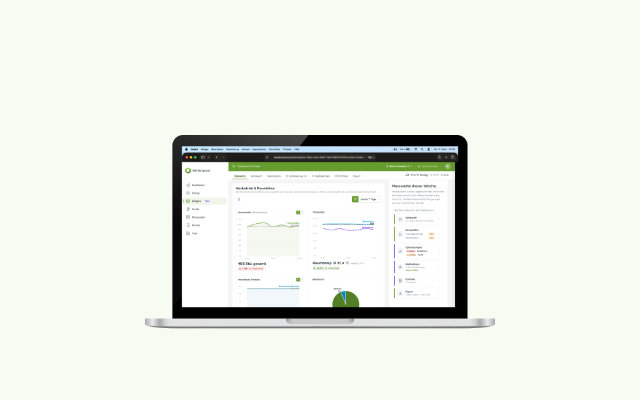
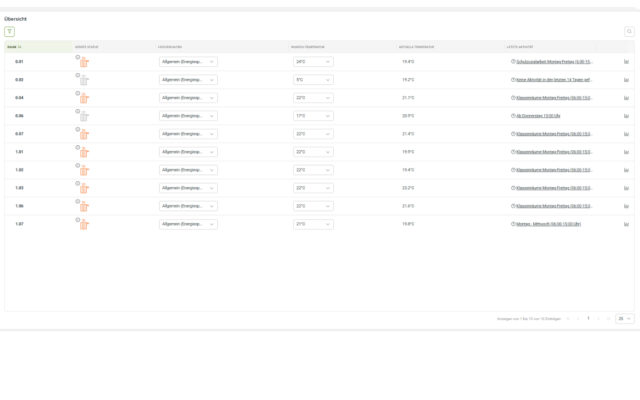
The screenshot shows the room overview on the platform, including the current heating status, as well as preset target temperatures and current room temperatures. These are measured by the LoRaWAN radiator thermostats and transmitted to the software.
The control logic configured in better.energy
In the controlled area of the school (Section A), the following basic configuration has been set up in the better.energy software. These settings form the basis for the temperature settings and the automatic control of the radiator valves via the LoRaWAN thermostats.
| Lower limit (frost protection) | 16 °C |
| Upper limit (overheating protection) | 24 °C |
| Setpoint temperature for unoccupied rooms | 18 °C |
| Setpoint temperature for occupied rooms | 22 °C |
| Offset (user adjustment) | − 2 °C |
| Occupancy times | 06:00 to 18:00 |
| Heating period | 16 September 2025 to 31 May 2026 |
| Summer mode | 1 June to 15 September (Thermostats deactivated) |
Furthermore, a separate set of rules has been defined for each room type. The table on the following page shows examples of the rules created for the ‘classroom’ room type. This set of rules is applied from Monday to Friday.
| Mon 08:00 to 15:00 | esired temperature 21 °C (occupancy period) |
| Mon from 15:00 | Temperature reduced to 18 °C |
| Wed, Fri, Sat, Sun | Temperature reduced to 18 °C (no lessons) |
| Temperature limits Mon to Fri | Upper and lower limits from global settings |
| Window open detection | If temperature drops by 1.5 °C or more, immediate reduction to 5 °C |
| Window closed detection | Automatic restoration of the desired temperature at the next time slot |
The real key is not a blanket reduction, but demand-based control. Three mechanisms work in tandem here:
Time- and occupancy-based regulation: Outside of hours of use, the setpoint temperature in the school is lowered. The smaller the difference between the indoor and outdoor temperatures, the lower the heat loss through walls, windows and ventilation. A room that is not heated at night or at weekends consequently loses less energy, which would otherwise have to be replenished on the next day of use.
Window detection: If the temperature drops by at least 1.5 °C, the system interprets this as an open window and immediately lowers the setpoint temperature to 5 °C. This prevents the heating system from working against the flow of air during brief ventilation, for example in the school’s classrooms. The desired temperature is automatically restored at the start of the next period of use.
Limiting manual intervention: The upper limit of 24 °C and the limited user offset prevent individual rooms from becoming permanently overheated. As the control sets apply per room type, the control system follows the actual usage pattern rather than operating according to a rigid curve.
The measurement results at the school
The following charts show the monthly heat consumption of both sections A and B of the school, taken directly from the dashboard of the better.energy – Monitor software. Turquoise represents Section B (reference, uncontrolled), and purple represents Section A (automatically controlled).
Heating period 2025/2026
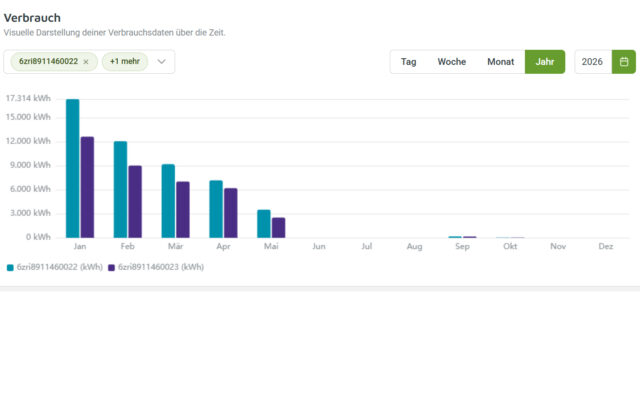
Total consumption since September 2025
(as at 10 June 2026)
Section B (uncontrolled): 99.141 MWh
Section A (controlled): 73.110 MWh
Savings: 26.031 MWh
= equivalent to 26.3 %
Two observations support the validity of the result:
1. Consistency:
The controlled range in the school remains below the reference range in every single heating month, not just on average. This pattern is evident across both years, which rules out the possibility of a random effect in individual months.
2. Physical plausibility:
The difference is greatest during the cold winter months and smaller during the transitional periods. This is to be expected, as an automatic reduction based on demand has a greater effect when the heating load is high than when heating requirements are low. During the summer months, the comparison between the two ranges is close to zero, because summer mode deactivates the thermostats and therefore no automatic control is in operation.
Methodology and context
To ensure the results are correctly contextualised, the conditions under which the measurements were taken must be disclosed.
Strengths of the setup:
Both areas are located in the same school building and were measured during the same period. Weather conditions and the condition of the building structure are therefore the same for both. In each case, the entire heating circuit was measured, not a selected subset of rooms.
Basis for comparison:
According to the school operator, both heating circuits supply areas of comparable size. This is the central assumption underpinning the comparison. If the area supplied is the same, the area is excluded from the calculation and the percentage difference in total consumption corresponds directly to the area-related saving. If the actual areas supplied by the two circuits differ, the figure shifts accordingly.
Conservative nature:
As corridors and ancillary areas were also included in the measurement, the calculation incorporates consumption where demand-based control has less impact. These areas tend to lower the reported percentage rather than increase it. The effect on the controlled teaching rooms themselves is therefore likely to exceed 26.3 per cent.
Factors not adjusted separately:
Differences in orientation, floor level, intensity of use and the composition of the heated areas were not factored out. Particularly in this type of building, with rooms facing in only one direction, solar gains can have a significant impact depending on the compass direction. These factors can alter the result in either direction.
No kWh/m² figure provided:
A specific figure in kilowatt-hours per square metre has deliberately not been provided, as no verified area data per heating circuit is available. Such a figure would give the false impression of accuracy that the available data does not support.
Limitations of the findings:
This is a measurement taken in a single case on one building over two heating seasons. The value is not statistically representative and must not be generalised as a typical saving.
Conclusions of the brief study
The area of the school automatically controlled by the better.energy software consistently consumed less heat over the entire two-year heating period than the reference area, which was of identical construction and received the same supply. The greatest difference in the amounts of heat consumed was evident during the cold winter months.
What is crucial to the reliability of this anonymised short study is not so much the individual percentage figure as the methodology behind it: the same building, the same time period, complete and comprehensive data collection, and verifiable raw data.
The combination of intelligent control with a defined set of rules and consumption measurement via monitoring makes the effect not only effective but also visible and verifiable. Every consumption figure is documented down to the month.
The value measured here relates to a single building. For general statements regarding typical savings, the separately agreed and verified figures from Betterspace apply, not this individual value.
Data basis
All values are sourced from the better.energy IoT platform. Data is collected via LoRaWAN heat meters fitted to the heating circuits, which transmit their readings digitally every hour. All devices were online throughout the entire measurement period; there were no data gaps. The complete raw data is available from Betterspace and can be traced on a monthly basis. The measurement was carried out and analysed by Betterspace. Date of analysis: 10 June 2026.
Would you like to find out more?
FAQ
Through a direct A/B comparison within the same school building. Two separate heating circuits were monitored, each with a LoRaWAN heat meter: one in controlled operation using better.energy, and one in uncontrolled manual reference mode. Measurements were taken hourly over two heating periods. As both areas are located in the same building and during the same period, the weather conditions and building structure are identical, and the difference can be attributed to the control system.
Yes, but to a limited extent. This is a measurement taken in a specific case. The extent of the savings depends on the building, its use and the initial operating conditions. Independent field and research studies on demand-based individual room control in non-residential buildings have found savings of a comparable magnitude (see sources).
Not from a blanket reduction, but from demand-based control. Outside of usage times, the temperature is lowered, which reduces heat loss because the difference between the indoor and outdoor temperatures becomes smaller. A window detection system stops the heating when windows are opened for a quick air change, and limit values prevent individual rooms from overheating continuously. These operating principles are also described in independent studies.
Die Erfassung erfolgte stündlich über Wärmemengenzähler direkt am Heizstrang, lückenlos und ohne Schätzungen. Alle Thermostate waren über den gesamten Zeitraum online. Gemessen wurde der vollständige Strang, nicht eine Auswahl günstiger Räume, was eine selektive Darstellung ausschließt. Die Rohdaten liegen vor und lassen sich nachvollziehen. Wärmemengenzähler arbeiten nach dem in der Norm EN 1434 beschriebenen Messprinzip.
Measurement data cannot be collected retrospectively. Anything not measured during this heating season will be missing as evidence later on. From 27 September 2026, under the amended Gesetz gegen den unlauteren Wettbewerb UWG (translated as Unfair Commercial Practices Act), environmental claims may only be made with robust evidence. The German Building Modernisation Act makes monitoring technology mandatory for non-residential buildings with a capacity of 70 kW or more by the end of 2029, and sustainability reporting under the CSRD is set to expand. Those who carry out continuous measurements today are creating the data foundation for both.
Sources and further references
The consumption figures presented in this brief study are derived from Betterspace’s own measurements (LoRaWAN heat meters, hourly readings, raw data held by Betterspace). The following references provide a technical overview of the operating principles, the regulatory framework and the metrological basis.
- Fraunhofer-Institut für Bauphysik IBP (2023): Kersken, M.; Sinnesbichler, H.: Energie-Einsparpotenzial einer intelligenten Heizungsregelung. IBP-Bulletin 579.
- González, M.; Schakib-Ekbatan, K.; Schwickert, S. (2023): Intelligentes Raumwärmemanagement als geringinvestive Energieeinsparmaßnahme in Nichtwohngebäuden. Feldstudie im Kreishaus Lippe. Bauen+ Kompakt, Institut für Energieforschung (IREES).
- Lierhammer, P. et al. (2026): Untersuchung der Effizienzsteigerung von Raumwärmebereitstellung in Nichtwohngebäuden durch präsenzabhängige Einzelraumregelung. 19. Symposium Energieinnovation, TU Graz.
- Deutsche Energie-Agentur (dena): dena-Gebäudereport (laufende Ausgaben). Einordnung des Energieverbrauchs im Gebäudebestand.
- Richtlinie (EU) 2024/825 (Empowering Consumers for the Green Transition, EmpCo). Umsetzung in Deutschland durch das Dritte Gesetz zur Änderung des UWG, anzuwenden seit 27. September 2026. Umweltbezogene Werbeaussagen sind nur noch mit Nachweis zulässig.
- Corporate Sustainability Reporting Directive (CSRD), Directive (EU) 2022/2464, amended by the ‘Stop the Clock’ Directive (EU) 2025/794 and the Omnibus I Package. Newly covered large companies must report from the 2027 financial year onwards (first report in 2028).
- Gebäudemodernisierungsgesetz (GModG), § 56. Nichtwohngebäude mit mehr als 70 kW Nennleistung müssen bis 31. Dezember 2029 mit Monitoring- und Gebäudeautomationstechnik ausgerüstet sein (zuvor § 71a GEG, Schwelle 290 kW). Umsetzung der EU-Gebäuderichtlinie EPBD, Richtlinie (EU) 2024/1275.
- DIN EN 1434: Wärmezähler. Beschreibt die Erfassung bezogener Wärmeenergie über Volumenstrom und Temperaturdifferenz.
- Messgeräte-Richtlinie 2014/32/EU (MID), Anhang MI-004: Anforderungen an Wärmezähler.: Wärmezähler. Beschreibt die Erfassung bezogener Wärmeenergie über Volumenstrom und Temperaturdifferenz.
- Messgeräte-Richtlinie 2014/32/EU (MID), Anhang MI-004: Anforderungen an Wärmezähler.