
















Feature better.energy – Analyze
Decisions based on figures
Find out what’s going on in your building

KPI Dashboard
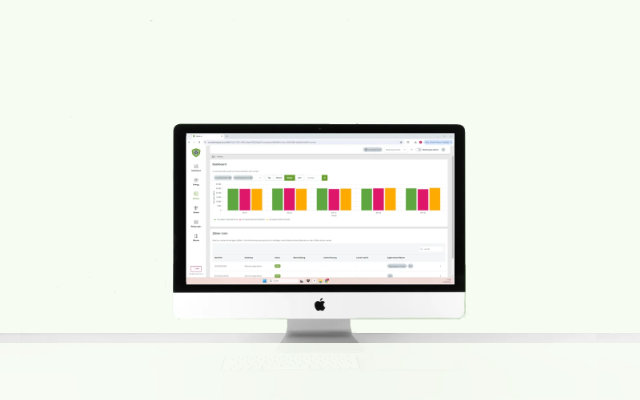
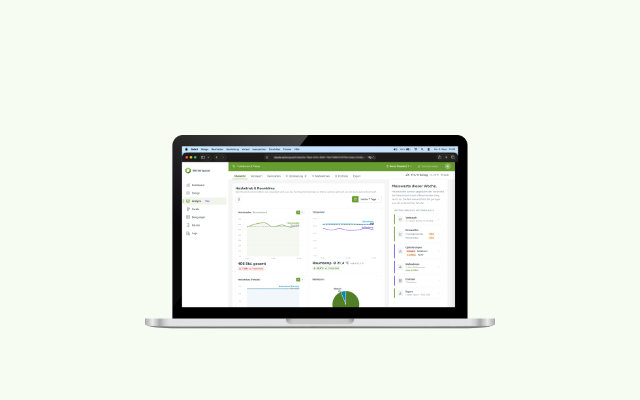
The central dashboard provides an overview of all key figures, such as heating hours, temperatures, heat loss through open windows and the operating mode.

Heating Overview
The heating overview shows you, by room type and floor, details such as how many hours the heating has been on and what the heating ratio is.

Consumption
You can see your heat consumption per meter on a daily, weekly, monthly or annual basis. Meter readings can also be entered manually.

Meter Lists
A clear list shows you all the meters in your building, including their status, latest readings and which rooms are assigned to each meter.
Identifying waste that otherwise goes unnoticed

Temperatures exceeding the setpoint
Rooms that consistently exceed a plausible setpoint are flagged and recorded in the history.

Temperatures falling below the setpoint
In rooms where users manually lower the temperature despite setpoint specifications, this indicates that the setpoints are too high.

Window-heating conflicts
As soon as a room is heated whilst a window is open, the event appears in the log. Frequent occurrences reveal structural or organisational patterns.

Usage profile deviation
Occupied and unoccupied periods are compared with actual heating behaviour. Discrepancies become apparent.
Reliable key figures, clearly reported

Weather adjustment
Normalisation by heating hours ensures that a mild January isn’t celebrated as a saving success and a cold February isn’t counted as a setback.

Occupancy efficiency
Find out how heating behaviour compares to the actual use of the rooms and compare different time periods.

Energy loss
Discover, broken down to individual rooms, where you are heating without providing any comfort to the occupants and how much heat is being lost.

Comparison mode
Compare how key figures develop over different time periods.
Well prepared for audits and reporting

Action Log
All energy-related changes to the system are automatically documented. You can see who changed what and when, and you can export this documentation.

Baseline
Define baselines for various key performance indicators and identify when and why you have fallen below or exceeded the set baseline.

Key Performance Indicator History
All data and key performance indicators are available as historical data spanning months and years, enabling you to make baseline comparisons and assess energy-related performance.

Compliance Export
Export key performance indicators, consumption figures, measures, measured values, anomalies, raw data or scores for any time period via CSV export and use them for reporting purposes.
Multiple sites, one comparison*

Company Dashboard
Here you’ll find all your sites clearly laid out in a single dashboard. You can view key metrics, anomalies and rankings in a direct comparison.

Portfolio Overview
You can view all anomalies across multiple sites in one place. This makes prioritising optimisation measures a breeze.

Top and Bottom Performers
The module provides you with an automatic ranking based on key metrics. This creates transferable blueprints for other sites.

Weather-Adjusted Site Comparison
By adjusting for weather conditions and normalising data from different sites, the data becomes objectively and fairly comparable.
Note: *The features in this category are part of the Enterprise package
Data Protection and Security
Servers in the EU
All data is stored exclusively on servers within the European Union in accordance with the GDPR, with no transfer to third countries.

Access Control
You determine who has access to which data on the platform. This ensures that only authorised individuals have access.
better.energy
How to make the most of what you already have
Analyze works directly with data from the better.energy platform. No additional hardware, no separate login, no parallel data storage. The module appears as an additional menu item in your usual portal and is ready to use as soon as it is activated.
Finally get answers instead of more questions
Get advice on better.energy – Analyze.