















The 6 key facts about better.energy – Analyze
- Transparency instead of an annual statement, with daily to monthly accuracy.
- Shows exactly where heating energy is being wasted, including recommendations for action.
- Minimally invasive, no building work required, no additional cables.
- Benefits for everyone, from management to building services.
- Control manages, Monitor measures, better.energy – Analyze evaluates.
- From day one, it’s only as good as the historical data it’s based on.
What is better.energy – Analyze?
better.energy – Analyze is a paid add-on module for the smart IoT platform better.energy. The analysis module of the better.energy IoT platform processes the platform’s energy and usage data into key performance indicators, identifies inefficiencies in heating operations and documents all energy-related changes to the system. better.energy – Analyze turns the data already available in better.energy into a basis for decision-making, highlights where inefficiencies in heating operations exist, and assists with regulatory compliance.
The starting point for our work
In numerous discussions with managing directors, facility managers, strategic procurement officers, asset managers and board members from hotels, care homes, schools, public sector organisations and, of course, our clients, the same issue has repeatedly come to light over the past few months. Where smart controls for radiators were already in use, these do indeed regulate the heating, but they do not provide any insights into key performance indicators such as heating degree days, the level of automation in the heating system or similar metrics.
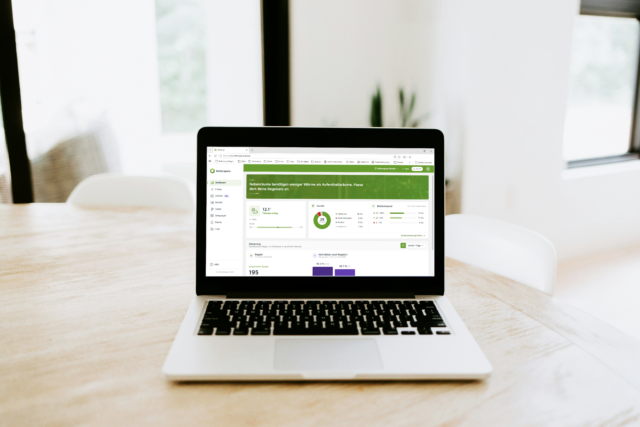
If smart meters are already in use – as they are mandatory under the German Heizkostenverordnung (engl. Heating Costs Regulation) – they provide raw consumption data. However, room temperatures are not controlled automatically, and correlations and opportunities for optimisation are not apparent. Not to mention that the figures are not adjusted for weather conditions or normalised. It is good to know what you are consuming, but without any background information on heating, these figures ultimately serve only as a warning that the annual heating bill will rise again and offer no potential for optimisation.
When asked whether they knew how efficiently they were heating, how high their consumption was, why consumption was so high, and what potential for optimisation the buildings still held, nobody could give us an answer. The problem is a lack of data. But even when this data is available, nobody was able to make use of it. There was always a lack of a solution that translates the data into meaningful insights. And it is precisely this level of insight that the new better.energy – Analyze module provides.
What you gain specifically from better.energy – Analyze
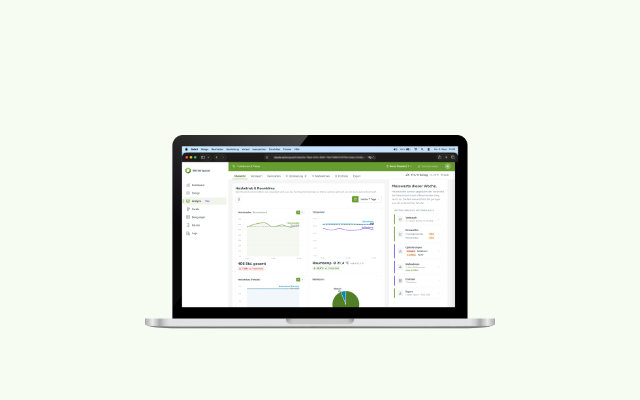
better.energy – Analyze is the analytics software for the better.energy platform. The module takes the data that the better.energy IoT platform already generates and turns it into:
- Transparency instead of an annual statement: You can see exactly how your heating usage is developing on a daily, weekly and monthly basis. Not just a one-off figure in March, but an ongoing overview.
- Specific evidence instead of vague assumptions: The module automatically detects overheating, underheating and heating with windows open, and shows you exactly where this is happening.
- Documentation for every rule change: If you adjust a night-time temperature reduction or change a set of rules, better.energy – Analyze documents this automatically.
- Reliable arguments for external use: The key performance indicators are suitable for reports to shareholders, for ESG reports, for audit discussions and for communication with investors and banks.
And all this without additional meters, without structural alterations, without parallel software. The analysis module of the better.energy IoT platform works with the data that is already being generated within the platform.
Who can benefit from better.energy – Analyze
We have deliberately designed better.energy – Analyze in such a way that it delivers added value to more than just a single role within the organisation. During development, we spoke to decision-makers at a wide range of levels, from building services to senior management. This led to the following breakdown:
| Role | How better.energy – Analyze specifically supports this role |
|---|---|
| Managing Director | Reliable figures for strategic decisions; arguments for investors, banks and supervisory bodies |
| Operators (chains, organisations, operating companies) | Enabling objective comparison of sites; identifying best practices; deriving portfolio-wide efficiency strategies; consistent communication with site management |
| Asset Manager | ESG-relevant key performance indicators over time; documented efficiency improvements as a value proposition for the property; a consistent database across the entire portfolio; a usable basis for reporting obligations |
| Facility Manager, Building Services | Specific guidance on how to act in the event of anomalies; recommendations for further optimisation steps regarding heating; documentation of their own work as evidence for superiors and auditors |
| Energy and Sustainability Managers | Data and support in preparing reports on compliance issues; transparency regarding the efficiency of implemented energy-saving measures; clear key performance indicators for the buildings’ heating efficiency |
Further reasons to use better.energy – Analyze
As we held discussions and began development, regulatory pressure became increasingly tangible. The German Building Modernisation Act (Gebäudemodernisierungsgesetz, GModG) requires operators of non-residential buildings with a heating or air-conditioning system with a rated output of 70 kW or more to fit their technical building services with building automation systems by 31 December 2029 at the latest (§ 56 GModG).
Large operators with an annual consumption of 7.5 GWh or more are also subject to requirements under the German Energy Efficiency Act (Energieeffizienzgesetz, EnEfG). Anyone seeking ISO 50001 certification or falling under the German Energy Services Act (Energiedienstleistungsgesetz, EDL-G) needs reliable performance indicators over time, not one-off snapshots.
better.energy – Analyze is our solution to both of these issues. The module transforms existing operational data into meaningful key performance indicators, highlights inefficiencies and documents the history in a format that can be utilised for audit and optimisation processes.

How we developed better.energy – Analyze
better.energy – Analyze wasn’t conceived on the drawing board. We designed, refined and tested the analytics module of the better.energy IoT platform in collaboration with the very people who would later use it on a daily basis. The first version is based on structured interviews and prototyping sessions with:
- Hotel operators of various sizes
- Managers from care homes and their operating organisations
- Operators of other types of non-residential buildings, including accommodation facilities and administrative premises
- Facility managers and building services engineers who are already working with better.energy
These sessions formed the basis for much of what is now included in better.energy – Analyze: the selection of key performance indicators, the structure of the dashboard, and the language used in the prompts. At the same time, we have closely aligned the tool with what energy consultants and auditors actually need in practice. The initial set of key performance indicators has been chosen to answer the questions that are routinely asked in day-to-day operations and during audit discussions.
„I was delighted to be part of the development of better.energy – Analyze. The module highlights where there is still untapped potential in our existing data that we haven’t utilised so far.“
Kevin Kirschke, Manager of the Moun10 Youth Hostel
What better.energy – Analyze does
Essentially, the module fulfils four tasks:
- Highlighting inefficiencies: The analysis software identifies typical patterns of energy wastage in heating operations, including conspicuously high temperatures, rooms cooling down and heating with windows open. These anomalies are not only displayed but are accompanied by specific recommendations on how the building services system can respond. Even if the team does not have its own energy manager.
- Demonstrating impact: Every change to the system and every measure implemented can be logged. Operators can thus document when they optimised what, and subsequently use the key performance indicators to assess how the situation has developed. This is precisely the core of a structured energy management approach.
- Providing data for compliance processes: Key performance indicators and records of measures can be exported as CSV files in a format that energy auditors can work with. Important to note: better.energy – Analyze is not a substitute for certification. We provide the robust data foundation upon which evidence in accordance with ISO 50001 or assessments under the GModG can be built. The actual certification and the associated consultancy remain the responsibility of the relevant authorities.
- Portfolio analyses: For operators with multiple sites, there is an additional overarching dashboard level that enables sites to be compared using standardised key performance indicators. Where are things going well, where is a closer look warranted, and which site serves as a benchmark for the others? Such questions can be answered at portfolio level using the analysis module of the better.energy IoT platform.
Where the data comes from
better.energy – Analyze draws its information from the better.energy system itself. This is based on:
- Sensor data from thermostats, window contacts and temperature sensors, which is transmitted to the platform hourly
- Occupancy data from the PMS or from a connected management system, provided an interface is available
- Actual heat consumption data from the LoRaWAN heat meters, provided the Monitor mudule is in use
- No external data sources, no manual data entry, no additional software required on the customer’s side. The better.energy platform’s analytics software works with the data that is already available.
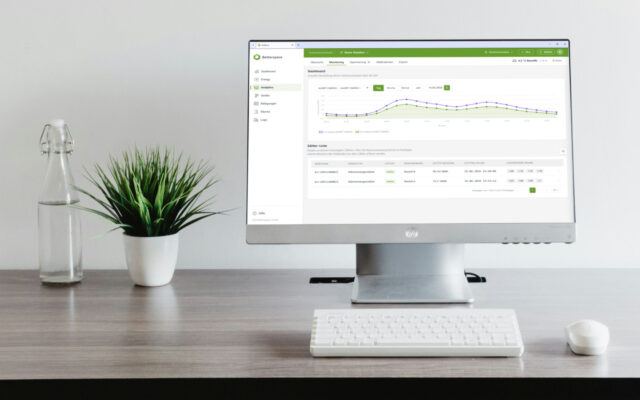
How the three better.energy modules work together
better.energy is designed as a modular system. Each module serves a specific purpose; together, they provide a complete picture.
better.energy – Control forms the foundation. Without the automated control of the radiators, neither the sensor data from which better.energy – Analyse derives its key performance indicators nor the anomalies it detects would be generated. Anyone using Control today is quietly building up a history with every day of operation, from which the analysis module of the better.energy IoT platform will draw conclusions tomorrow.
better.energy – Monitor complements better.energy – Analyze by providing the actual consumption data. Whilst better.energy – Analyze uses control data to identify where energy is structurally lost and how efficiently the system is operating, Monitor uses heat meters to measure actual consumption in kilowatt-hours. The combination of both modules makes the impact of optimisations visible not only in key performance indicators, but also in consumption figures and thus in euros.
better.energy – Analyze is designed in such a way that it essentially works even without the monitoring module. Meter data can be entered manually into the system. However, those using all three modules can view control, consumption and evaluation in a single view. It is in this configuration that the platform becomes a genuine efficiency tool.
What’s on the roadmap for the coming year
better.energy – Analyze is deliberately launched as a clear, focused level of analysis. We are already exploring several enhancements for the coming year. These include an expanded set of key performance indicators and systematic benchmarking. The aim is not only to compare our own figures internally, but also to place them in a meaningful context, both within a portfolio and beyond our own organisation.
Meter reading for additional utilities is also under discussion. In addition to heat, it should in future be possible to record electricity, gas, water and district heating via the platform. This will make the analysis module of the better.energy IoT platform the central hub for a site’s entire energy footprint, not just the heating component – although, as is well known, this accounts for the largest share of energy costs.
The topics of indoor climate and heat protection will be addressed within the analytical framework in the future. Additional sensors for CO₂, humidity and temperature are set to expand the data set. As summers become hotter, heat protection in care homes, schools and office buildings is coming into focus just as much as heating in winter. We aim to map both aspects using the same tools.
Building visualisation is another feature to be implemented using better.energy – Analyze. We are working on a spatial visualisation layer that displays key metrics and anomalies directly within an overview of the site. Fewer clicks, quicker navigation, shorter response times.
Which of these building blocks are incorporated into the platform, and in what order, will depend on the feedback received on the first version. We will only confirm individual features once they are actually being implemented.
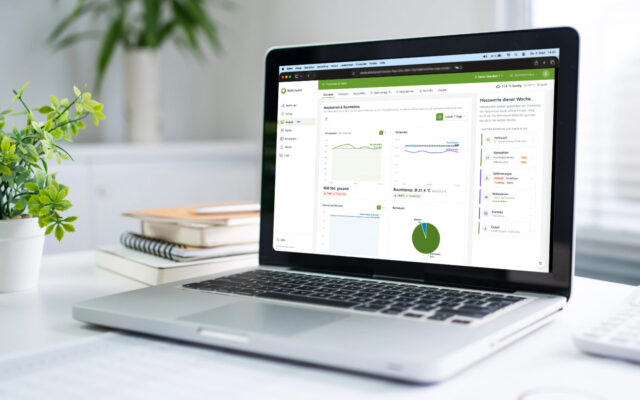
Why you shouldn’t wait
Finally, let’s be clear about one thing: from day one, better.energy – Analyze is only as good as the historical data on which it is based.
Every key performance indicator becomes more meaningful the longer the period it can look back on. Proving the effectiveness of a measure requires a reliable baseline. Benchmarking requires comparative figures from, ideally, a full heating season. Anyone who only launches the better.energy platform’s analysis software when they urgently need it ends up with a module that lacks a solid foundation.
This leads to a clear conclusion. Anyone using better.energy today builds up the database with every day of operation, from which better.energy – Analyze can derive meaningful insights tomorrow. Anyone who waits and adds the analysis module of the better.energy IoT platform in a year’s time is buying the same product, but with significantly less impact because the historical data is missing. Anyone who isn’t using better.energy at all today simply has no foundation for better.energy – Analyze, no matter how mature the module is at the time of the decision.
So the better time is today rather than in twelve months’ time. You’ll either go through the 2026/27 heating season with a robust data foundation or without one. The decision is yours to make now.
Would you like to find out more?
Sources and further information
- Betterspace: IoT plattform better.energy
- Betterspace: better.energy – Analyze
- Europäisches Parlament und Rat: Richtlinie (EU) 2024/1275 (EPBD)
- Bundesministerium für Wirtschaft und Energie und Bundesministerium des Innern, für Bau und Heimat: Regeln für Energieverbrauchswerte und Vergleichswerte im Nichtwohngebäudebestand (2021)